In this article (12 sections)
- What does the 12-week plan look like?
- Weeks 1 and 2: Excel, properly
- Weeks 3 to 5: SQL, the skill almost every post asks for
- Weeks 6 to 8: Power BI, and enough Tableau to switch
- Weeks 9 and 10: Python, Pandas and statistics
- Weeks 11 and 12: a capstone you can explain
- What about the Google Data Analytics Certificate?
- Where does a free plan stop working?
- Our Data Analytics programme, and who it is not for
- Who this is not for
- What to do this week
- Sources
Related programme: the Data Analytics with Generative AI course (3–4 months; ₹90,000 (inclusive of GST) · EMI from ₹4,000/month).
In short: you can learn the skills a fresher data analyst job asks for without paying for a course. A realistic plan is 12 weeks at 8 to 10 hours a week: Excel on LearnFree.org and Microsoft Support, SQL on Kaggle Learn, Power BI through Microsoft Learn's free PL-300 learning paths, a little Tableau Public, Python and Pandas on Kaggle, statistics on Khan Academy, and a final project on Indian open data. I checked every resource on 9 November 2026. The paid extras (certificates and exams) are optional.
I am Pankit Kumar. I lead the Data Analytics programme at NeuraPath and work as a Senior Data Scientist at Parexel. Most people who ask me about becoming a data analyst are freshers or are switching from commerce, sales or operations, and the first question is usually whether they can start without spending money. You can. Below is the order I would follow, built from free material only, with something to build every block so you finish with a portfolio.
Not sure where you would start? Book a 15-minute counselling call and we will tell you which weeks you can skip.
What does the 12-week plan look like?
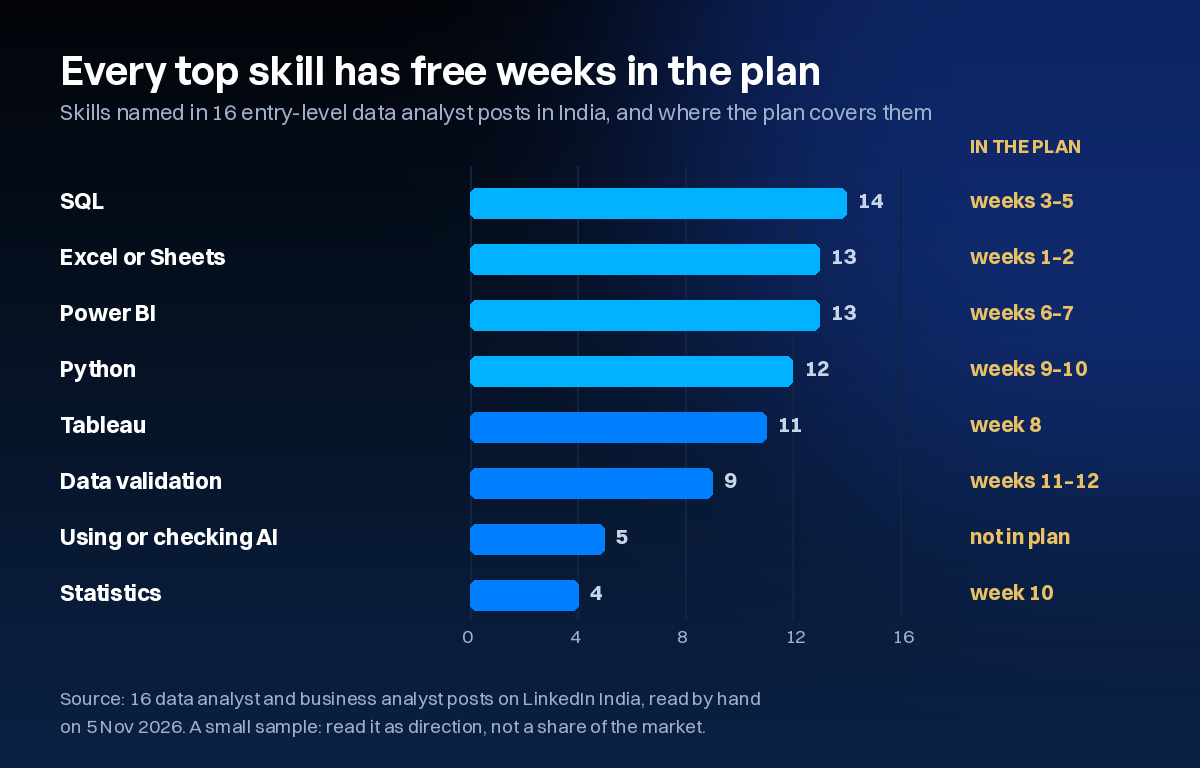
Five blocks, in the order the skills build. The order follows what job posts ask for: on 5 November 2026 I read 16 entry-level data analyst posts in India, and SQL appeared in 14, Excel in 13, Power BI in 13 and Python in 12.
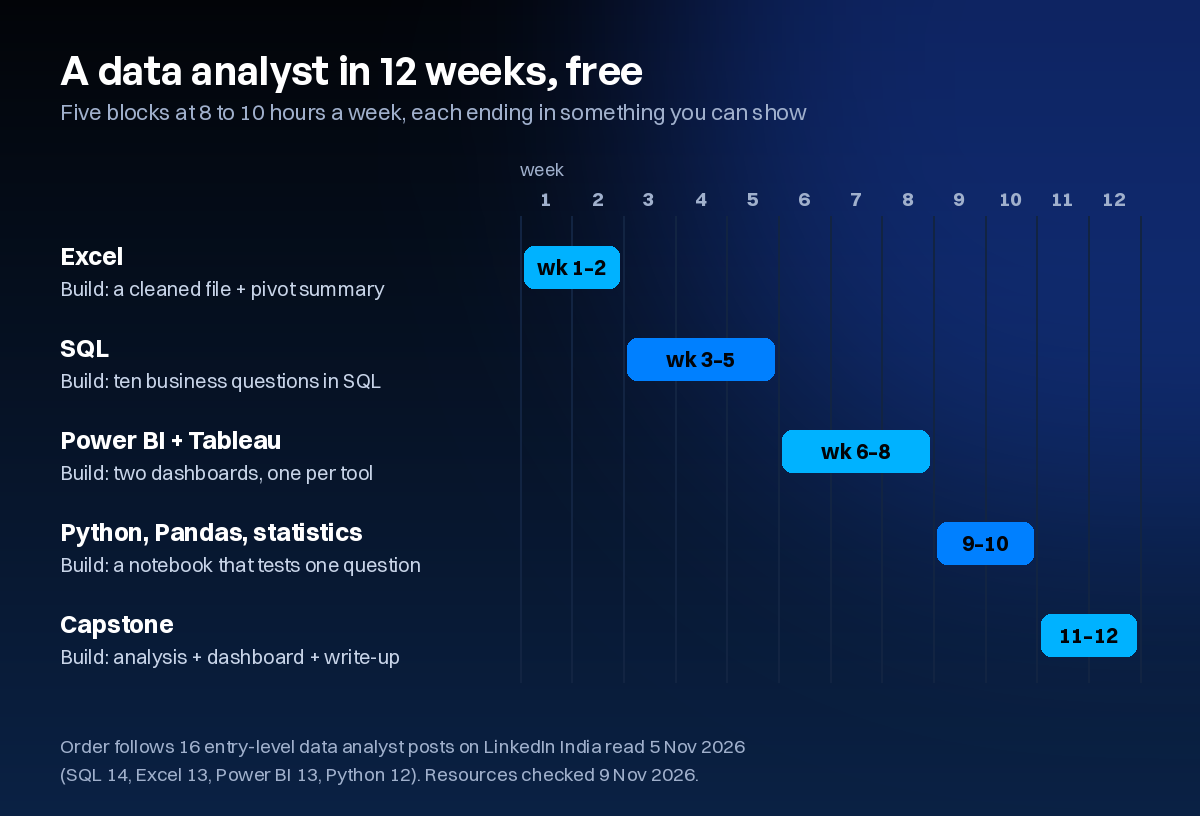
| Weeks | Block | Free resources | You build |
|---|---|---|---|
| 1–2 | Excel | LearnFree.org Excel Foundations; Microsoft Support on XLOOKUP, PivotTables and Power Query | A cleaned sales file with a pivot summary |
| 3–5 | SQL | Kaggle Learn Intro to SQL and Advanced SQL; LeetCode SQL 50 for practice | Ten business questions answered in SQL |
| 6–8 | Power BI and Tableau | Microsoft Learn PL-300 learning paths; Power BI Desktop; Tableau Public | Two dashboards, one in each tool |
| 9–10 | Python, Pandas and statistics | Kaggle Learn Python and Pandas; Khan Academy Statistics; OpenIntro Statistics | A notebook that cleans data and tests one hypothesis |
| 11–12 | Capstone | data.gov.in; GitHub | One end-to-end analysis with a dashboard and a write-up |
Weeks 1 and 2: Excel, properly
LearnFree.org (the site that used to be GCFGlobal) has an "Excel: Foundations" series that it describes as "this free Excel series": 36 short episodes, about five and a half hours in total, including PivotTables. It does not cover lookups or Power Query, so add Microsoft Support's own pages on XLOOKUP and "About Power Query in Excel". Microsoft says Power Query is available in Excel for Windows, Excel for Mac and Excel for the web, so the free web version of Excel is enough to practise.
Do not skip Power Query because it sounds advanced. Cleaning data you receive from someone else is most of the job.
Build: download a messy sales or orders file, clean it with Power Query, and summarise it with a PivotTable and two charts.
Weeks 3 to 5: SQL, the skill almost every post asks for
Kaggle Learn is the best free start. Intro to SQL lists "3 (estimated)" hours and Advanced SQL "4 (estimated)", and both pages say "No cost, like all Kaggle Learn Courses". The Advanced course has a lesson on WITH clauses (CTEs) and one called "Analytic Functions", which are window functions. You write queries in the browser against Google BigQuery, so there is nothing to install.
Seven hours of lessons is the start, not the end. Spend most of these three weeks practising. LeetCode's "SQL 50" study plan is free to start and is built for about a month of practice. ThoughtSpot's SQL tutorial (the old Mode tutorial, which now redirects there) has a good section on window functions.
In one of our live SQL classes on 7 November, the query that caused the most discussion was "find the employee with the second highest salary in each department". It looks simple. The two mistakes are filtering on the wrong rank number, and using RANK() when two people share a salary, which skips a number and can return nobody at rank 2. DENSE_RANK() handles the tie. Interviewers love this question for exactly that reason. Practise it until you can explain the difference out loud.
Build: ten business questions on one dataset (top products, month-on-month growth, repeat customers, a running total), each answered in SQL and committed to GitHub.
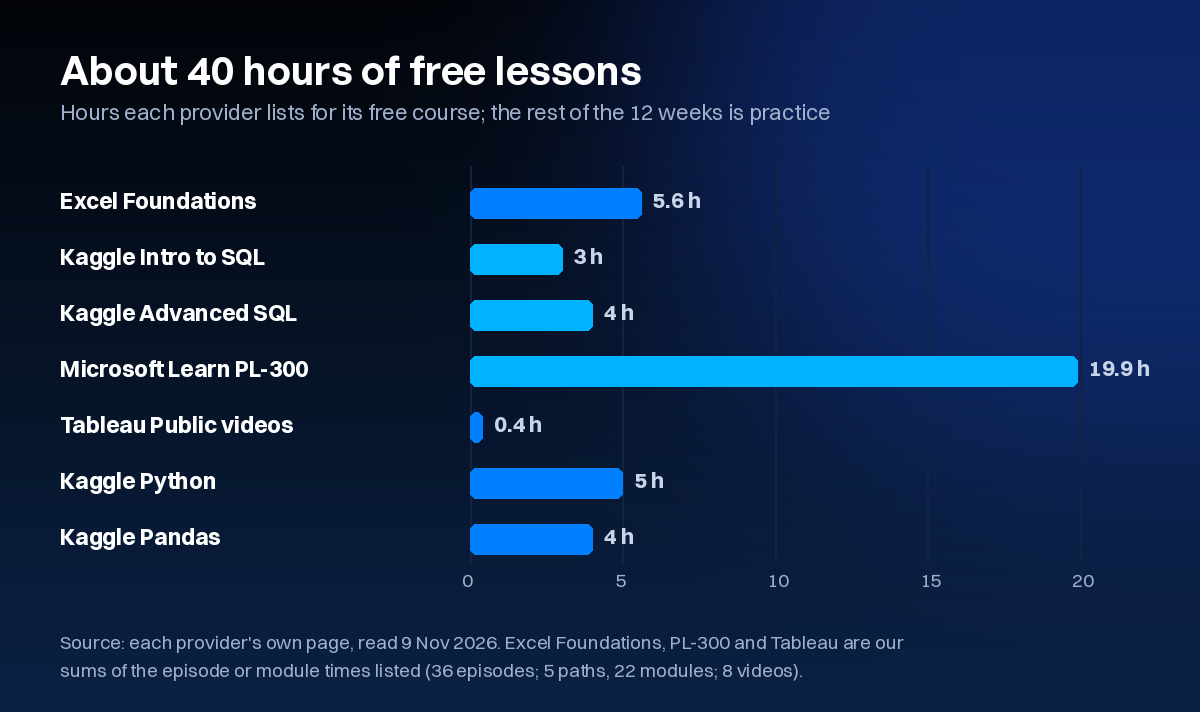
The course time listed for the whole plan adds up to roughly 40 hours. The other 60 to 80 hours of the 12 weeks are practice and projects. That is normal, and it is where people either push through or stall.
Want to see how a full programme sequences this? All seven modules of our Data Analytics curriculum, with their live hours and the portfolio piece at the end of each, in a free brochure.
View the curriculumWeeks 6 to 8: Power BI, and enough Tableau to switch
Power BI Desktop is a free download. Microsoft says it lets you "create rich, interactive reports with visual analytics at your fingertips—for free". Microsoft Learn's free learning paths for the PL-300 Power BI Data Analyst exam cover the whole tool in five paths and 22 modules, about 20 hours of listed time: getting started, preparing data, modelling data, designing reports, and managing and securing them. Do them in order, and give the modelling path the most time, because DAX and the data model are what separate a real Power BI user from someone who drags charts onto a page.
Two things cost money, and you do not need either to learn. The PL-300 exam was ₹4,865 when I selected India on Microsoft's page on 9 November 2026. Sharing reports online needs a Power BI Pro licence. You can show your dashboards in a portfolio as screenshots and the .pbix file.
In week 8, rebuild one dashboard in Tableau Public, which Tableau describes as "a free platform to explore, create, and publicly share data visualizations". Its how-to videos take under half an hour. Eleven of the 16 posts I read named Tableau, usually as "Power BI or Tableau", so being able to work in both widens the jobs you can apply for. Everything you save on Tableau Public is public, so use public data only.
Build: two dashboards on the same data, one in Power BI and one in Tableau Public, each with a one-line headline that states the finding.
Weeks 9 and 10: Python, Pandas and statistics
Kaggle Learn's Python course lists "5 (estimated)" hours and its Pandas course "4". After that, the official "10 minutes to pandas" page is a good reference. You do not need software engineering depth. You need to load a messy file, join it to another table, group and reshape it, and get the same answer next week without doing it by hand.
For statistics, Khan Academy's Statistics and probability course has 16 units. Focus on distributions, sampling, confidence intervals and hypothesis tests. The free OpenIntro Statistics book (4th edition) is a good second explanation; its download page suggests a contribution, but you can set the price to zero.
Build: a notebook that cleans a dataset in Pandas and tests one business question, such as whether weekend orders are larger than weekday orders, with a plain-language conclusion.
Weeks 11 and 12: a capstone you can explain
Pick a dataset from the Open Government Data Platform India, which listed 358,249 resources when I checked on 9 November 2026, or from Kaggle Datasets. Choose a question someone would pay to have answered. Clean the data, analyse it in SQL or Python, build the dashboard, and write one page: the question, what you found, what you recommend, and what the data cannot tell you.
Then check one number by hand. Take any total on your dashboard and reconcile it against the raw data. Nine of the 16 entry-level posts I read asked for data validation or reconciliation in some form. It is the habit that makes managers trust an analyst, and almost no free course teaches it.
Put everything on GitHub. A GitHub account is free, and GitHub's "Introduction to GitHub" exercise takes under an hour.
What about the Google Data Analytics Certificate?
It is a well-built course and many people start there. On 9 November 2026 the Coursera page listed it as a "9 course series" taking about "6 months at 10 hours a week". You can audit the courses to view the material for free. The certificate itself costs INR 1,923 a month after a 7-day free trial, and financial aid is available. If a certificate matters to you, it is reasonable value. If you are learning for skills, auditing its courses alongside this plan is enough.
Where does a free plan stop working?
Free resources teach the tools well. They are weak at four things:
- 1Feedback. Nobody tells you that your dashboard double-counts orders or that your SQL answers a slightly different question.
- 2Structure. Many people stall somewhere between SQL and Power BI, when the exercises stop being guided.
- 3Interview practice. Writing SQL live while someone watches is its own skill.
- 4Getting seen. Mock interviews, referrals and introductions to hiring teams are not on any course page.
If you have a study group, a mentor at work or a friend in the field, a free plan can take you all the way, and freshers are hired as analysts every year from exactly this kind of start. If you do not, that is the gap a paid programme fills.
Is a ₹90,000 data analytics course worth it for you?
Answer five questions. You see the result straight away; nothing is stored.
- 1. Have you tried learning on your own and stalled part-way?
- 2. Do you want a live instructor you can ask questions?
- 3. Do you need someone to review your projects and give feedback?
- 4. Are you trying to switch careers (not just add a skill)?
- 5. Do you need help preparing for interviews?
Our Data Analytics programme, and who it is not for
I teach it myself. It runs live online, taught by working practitioners, with optional classroom labs at our Noida centre, and every session is recorded. You can take it over two months on weekdays or 3 to 4 months on weekends while you work. It covers the same skills as the plan above, plus using AI tools for analysis and checking what they produce, and every module ends in a reviewed portfolio piece, from two Power BI dashboards and a SQL case study to the capstone you present on demo day.
The fee is ₹90,000 (inclusive of GST) · EMI from ₹4,000/month. Eligible learners are covered by our job guarantee with minimum package assurance, or 50% of the fee back, for those meeting the attendance, deliverable and capstone criteria. Terms and conditions apply. The conditions are in our job guarantee terms: at least 70% in every assessment, at least 80% live attendance, four or more logged applications a week, fees settled, and attending the interviews we arrange, within six months of certification.
For what a full syllabus should contain, read our data analyst syllabus, built from job posts. For what freshers earn, see our data analyst salary for freshers guide.
Who this is not for
- People who will follow the free plan with a study group or mentor. Do that first. You can join a cohort later if you get stuck.
- People who cannot give two to four months of steady weekly hours.
- People who want to build machine learning models as their main job. Our free data science plan is the route for that.
What to do this week
- 1Make a free Kaggle account and finish the first lesson of Intro to SQL.
- 2Open the free Excel for the web and load any CSV into Power Query.
- 3Block eight hours in your calendar for next week, written down, with start times.
- 4Run your CV through our free skill check to see which data analyst requirements you already meet.
Still unsure whether data analytics is right for you?
Send us your current qualification or role and what you are trying to achieve. We pass it to one of our instructors, who are working data scientists, and reply with the skills you would need and whether a structured course makes sense for you at all.
Sources
All pages read on 9 November 2026 unless marked.
- LearnFree.org: Excel Foundations
- Microsoft Support: Excel help and learning and About Power Query in Excel
- Kaggle Learn: Intro to SQL, Advanced SQL, Python, Pandas
- LeetCode: SQL 50 study plan
- ThoughtSpot: SQL tutorial (formerly Mode)
- Microsoft Learn: Power BI Data Analyst Associate (PL-300), learning paths and exam price
- Microsoft: Power BI Desktop
- Tableau Public: about and how-to videos
- pandas: 10 minutes to pandas
- Khan Academy: Statistics and probability
- OpenIntro Statistics, 4th edition
- Coursera: Google Data Analytics Professional Certificate
- Open Government Data Platform India
- GitHub Skills
- Job post counts: 16 entry-level data analyst and business analyst posts on LinkedIn India, read by hand on 5 Nov 2026 (see our data analyst syllabus article)
Frequently asked questions
Can I become a data analyst with free courses?
Yes. Every skill entry-level posts ask for, from Excel and SQL to Power BI, Python and statistics, is taught well in free courses. You will need projects to show for it, and someone to check your work and practise interviews with, which free courses rarely provide.
What is the best free course for a data analyst?
There is no single best one. Kaggle Learn is the best free start for SQL and Python, Microsoft Learn's free PL-300 learning paths are the best for Power BI, and LearnFree.org's Excel Foundations series covers Excel basics. The 12-week plan in this article puts them in order.
Is the Google Data Analytics Certificate free?
You can audit its courses for free. The certificate itself is paid: on 9 Nov 2026 the Coursera page listed INR 1,923 a month after a 7-day free trial, for a 9-course series planned at about 6 months of 10 hours a week. Financial aid is available.
Is Power BI free to learn?
Yes. Power BI Desktop is a free download and Microsoft Learn's PL-300 learning paths are free, about 20 hours across 22 modules. The PL-300 exam is paid (INR 4,865 when the India price was checked on 9 Nov 2026), and sharing reports online needs a paid Power BI Pro licence. Neither is needed to learn.
How long does it take to learn data analytics for free?
About three months at 8 to 10 hours a week to cover the core skills, which is what this plan assumes. If you are starting from zero with Excel and have never coded, allow four to five months.
Can a fresher from a commerce or arts background become a data analyst?
Yes. Entry-level analyst posts ask for skills, not a particular degree: SQL, Excel, a BI tool and clear communication. Commerce graduates often have an advantage with business metrics. Show the skills through two or three projects and you compete on the same terms.

Pankit Kumar has 10 years in Data Science & AI, building and shipping production systems in regulated pharma and clinical environments. He is a freelance trainer at Boston Institute of Analytics, AnalytixLabs and Scaler, and has taught this material to thousands of working professionals.
This article is part of our Data Analytics with Generative AI programme — 3–4 months. The full analyst stack — Excel, SQL, Power BI and Python pipelines — then a generative-AI layer you can prove is right.
Explore Data Analytics with Generative AI