Data analyst syllabus 2026: what a job-ready course must cover
In this article (16 sections)
- What do data analyst job posts in India actually ask for?
- The syllabus, module by module
- 1. Excel, SQL and a BI tool (about a third of the course)
- 2. Python for analysis
- 3. Data validation and metric definitions
- 4. Visualisation and storytelling
- 5. Statistics for business questions
- 6. AI in the analyst's workflow
- 7. A capstone you can defend
- Why is the demand worth training for?
- What is changing in 2026, and what is not
- What we changed in our own syllabus on 5 November 2026
- Our Data Analytics programme, and who it is not for
- Who this is not for
- What to do this week
- Sources
Related programme: the Data Analytics with Generative AI course (3–4 months; ₹90,000 (inclusive of GST) · EMI from ₹4,000/month).

In short: a job-ready data analyst syllabus in 2026 covers SQL up to window functions, Excel with Power Query, one BI tool in depth (Power BI, plus enough Tableau to switch), Python with Pandas, statistics for business questions, data validation, and using AI tools while checking their output. In 16 entry-level job posts in India that I read on 5 November 2026, SQL appeared in 14, Excel and Power BI in 13 each, and Python in 12. Freshers can learn all of it in three to six months.
I am Pankit Kumar. I lead the Data Analytics programme at NeuraPath and work as a Senior Data Scientist at Parexel. On 5 November 2026 I read 16 data analyst and business analyst job posts in India that asked for zero to three years of experience, and Microsoft's current outline for the PL-300 Power BI exam. Then I checked our own syllabus against them and changed three modules. This article is what a syllabus should contain, why, and what we changed.
Not sure where you would start? Book a 15-minute counselling call and we will tell you which module you can skip.
What do data analyst job posts in India actually ask for?
The same short list, again and again. The posts I read were from employers including Amazon, PhonePe, Gartner, Oliver Wyman, Navi, IDFC FIRST Bank, TriNet, Comscore, Tekion and Heads Up For Tails, across Gurugram, Bengaluru, Mumbai, Pune, Hyderabad and Chennai.
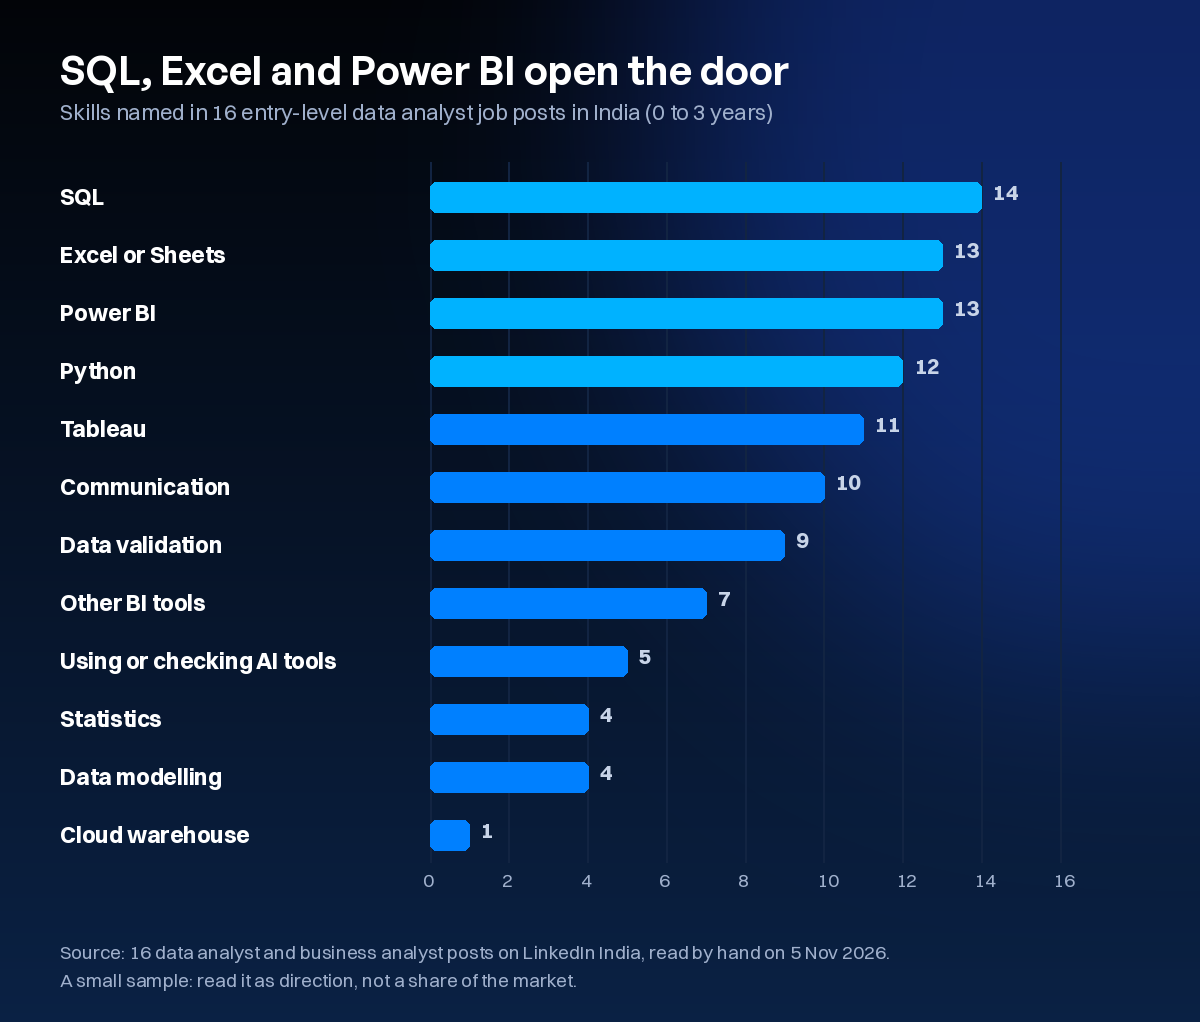
| Skill | Posts that named it (of 16) |
|---|---|
| SQL | 14 |
| Excel or Google Sheets | 13 |
| Power BI | 13 |
| Python | 12 |
| Tableau | 11 |
| Communication with stakeholders | about 10 |
| Data quality, validation or reconciliation | about 9 |
| Another BI tool (QuickSight, Qlik, Superset, Zoho) | 7 |
| Using AI tools, or judging AI output | 5 |
| Statistics or hypothesis testing | 4 |
| Looker | 4 |
| Data modelling (fact and dimension tables) | 4 |
| Cloud warehouse (BigQuery, Snowflake, Redshift) | 1 |
| A/B testing | 0 |
This is a small sample, read on one day, so treat it as direction rather than a market share. Three things in it are worth more than the counts.
First, SQL is close to universal, and the posts that describe it want more than SELECT and GROUP BY. Kite and Tricog Health name window functions and CTEs. Oliver Wyman calls SQL and Excel "non-negotiable".
Second, the BI tool is usually "one of". Most posts say Power BI or Tableau or Looker. Learn one well and the others take days, not months.
Third, data validation came up almost as often as communication. Reconcile this number, check that dashboard against the source, define the metric so two teams stop arguing. That is the work employers pay for, and many courses never teach it as a skill.
The syllabus, module by module
Here is what each block should contain and why, in the order the skills build.
1. Excel, SQL and a BI tool (about a third of the course)
- Excel at depth: lookups, pivots, Power Query for cleaning, and scenario models. Python in Excel is now available on Windows, the web and Mac with a qualifying Microsoft 365 plan, and is worth one session.
- SQL from joins to window functions, CTEs and query tuning, on a real hosted database rather than a toy file.
- Power BI the way the exam describes it. Microsoft's PL-300 outline (skills measured as of 20 April 2026) splits the exam into preparing the data (25 to 30%), modelling it (25 to 30%), visualising and analysing it (25 to 30%), and managing and securing it (15 to 20%). It says plainly: "You should be proficient at using Power Query and Data Analysis Expressions (DAX)."
- Enough Tableau to rebuild one of your dashboards, so a "Power BI or Tableau" post does not rule you out.
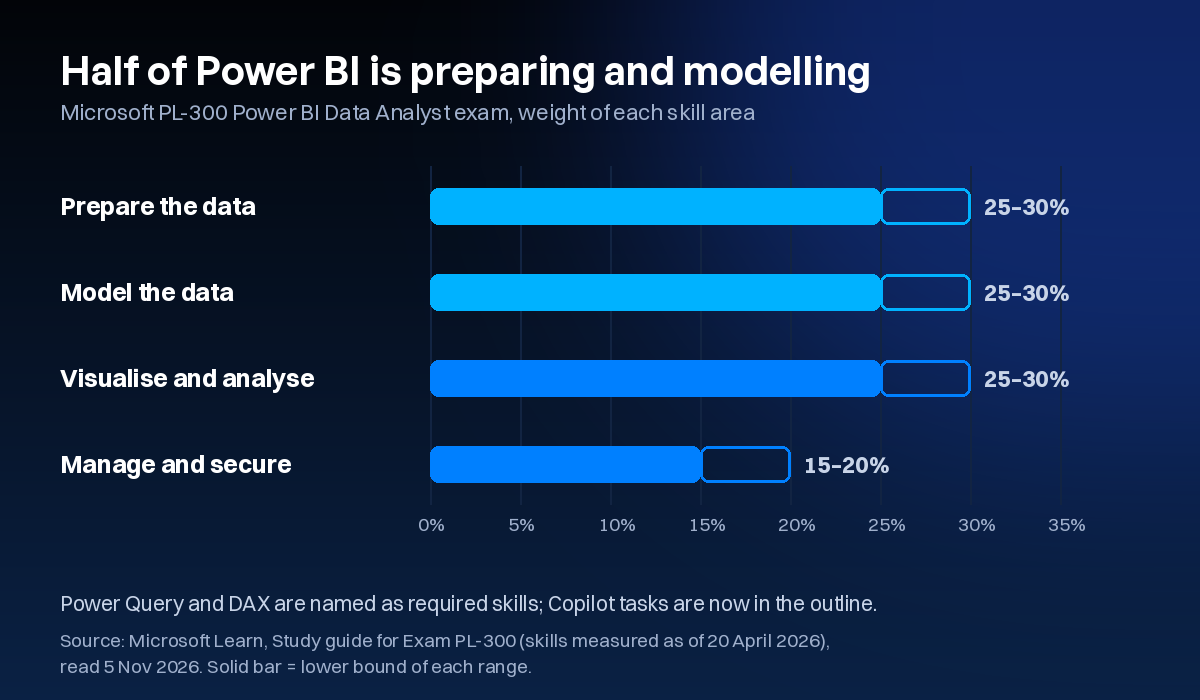
Look at those weights. Preparing and modelling data are half the exam, and the charts are a quarter. A course that spends most of its Power BI time on visuals is teaching the easy quarter. The same outline now includes Copilot tasks, such as creating a narrative visual and a report page with Copilot. Copilot in Power BI needs paid Fabric or Premium capacity, so learn what it does, but do not build your skills on having it.
See our full curriculum first. All seven modules with their hours, the portfolio pieces and both batch timings, in a free brochure.
View the curriculum2. Python for analysis
Syntax, data structures, functions and error handling, then Pandas properly: merges, group-by, reshaping, missing data, dates and regex. Add Git basics and AI-assisted coding, because that is how analysts write code now. You do not need software engineering depth. You need to clean a messy file, join it to a database table and produce the same answer next week without redoing it by hand.
3. Data validation and metric definitions
This is the block most syllabi leave out, and the one I would least want to lose. Reconcile a total against the source system. Find the join that counts orders twice. Write down what "active customer" means before you build the chart. One of our lab exercises is built around exactly this trap: two revenue numbers that disagree, and how to find out which one is right.
4. Visualisation and storytelling
Choosing a chart that answers the question, then writing a headline, the evidence and a recommendation. Matplotlib, Seaborn or Plotly for analysis in Python. This is short in hours and long in impact, because it is what a manager sees.
5. Statistics for business questions
Sampling, confidence intervals and hypothesis tests, taught on questions like "did the new checkout page change conversion?" Add reading an A/B test result, and product metrics: funnels, cohorts and retention. Regression and a first look at trees and clustering round it off. Only four of the 16 posts named statistics, but PhonePe, Navi, Comscore and IDFC FIRST Bank did, and those are the interviews where it decides the outcome.
6. AI in the analyst's workflow
Every analyst now works next to an AI assistant. In the Stack Overflow Developer Survey 2025, 84% of respondents were using or planning to use AI tools, and 46% said they actively distrust the accuracy of what those tools produce. That gap is the skill. Learn to prompt for analysis, retrieve from your company's own data, automate a recurring report, and then prove or disprove the AI's number before anyone acts on it. Finkraft's post requires hands-on use of ChatGPT or Claude, and Vamstar's entry-level post asks for "analyzing and evaluating AI generated outputs".
7. A capstone you can defend
One end-to-end project: a vague business question, the data, the cleaning, the analysis, a dashboard and a short write-up, presented to someone who asks hard questions. This is what you talk about in interviews.
Why is the demand worth training for?
Because employers in India expect these roles to grow faster than they do globally. In the World Economic Forum's Future of Jobs Report 2025, Indian employers expected net growth of 54% for data analysts and scientists between 2025 and 2030, against 41% globally, and 17% for business intelligence analysts. They also expected "AI and big data" to be the skill whose use grows most by 2030, named by 94% of organisations surveyed in India. These are employer expectations, not a count of job openings, but they point the same way as the job posts.
Is a ₹90,000 data analytics course worth it for you?
Answer five questions. You see the result straight away; nothing is stored.
- 1. Have you tried learning on your own and stalled part-way?
- 2. Do you want a live instructor you can ask questions?
- 3. Do you need someone to review your projects and give feedback?
- 4. Are you trying to switch careers (not just add a skill)?
- 5. Do you need help preparing for interviews?
What is changing in 2026, and what is not
Three things changed this year. Power BI's exam now tests Copilot and newer modelling features such as calculation groups and visual calculations. Python moved inside Excel. And the Google Data Analytics Certificate on Coursera now lists a Python course, "Introduction to Data Analysis Using Python", and a Gemini-based job search course alongside its original modules.
What did not change is the base. SQL, Excel, a BI tool and the habit of checking your numbers were the core in 2020 and they still are. AI tools make a good analyst faster. They do not replace knowing whether the answer is right.
What we changed in our own syllabus on 5 November 2026
After reading these posts, we updated three of our seven modules. No module lost hours and the total stays at 118 live hours.
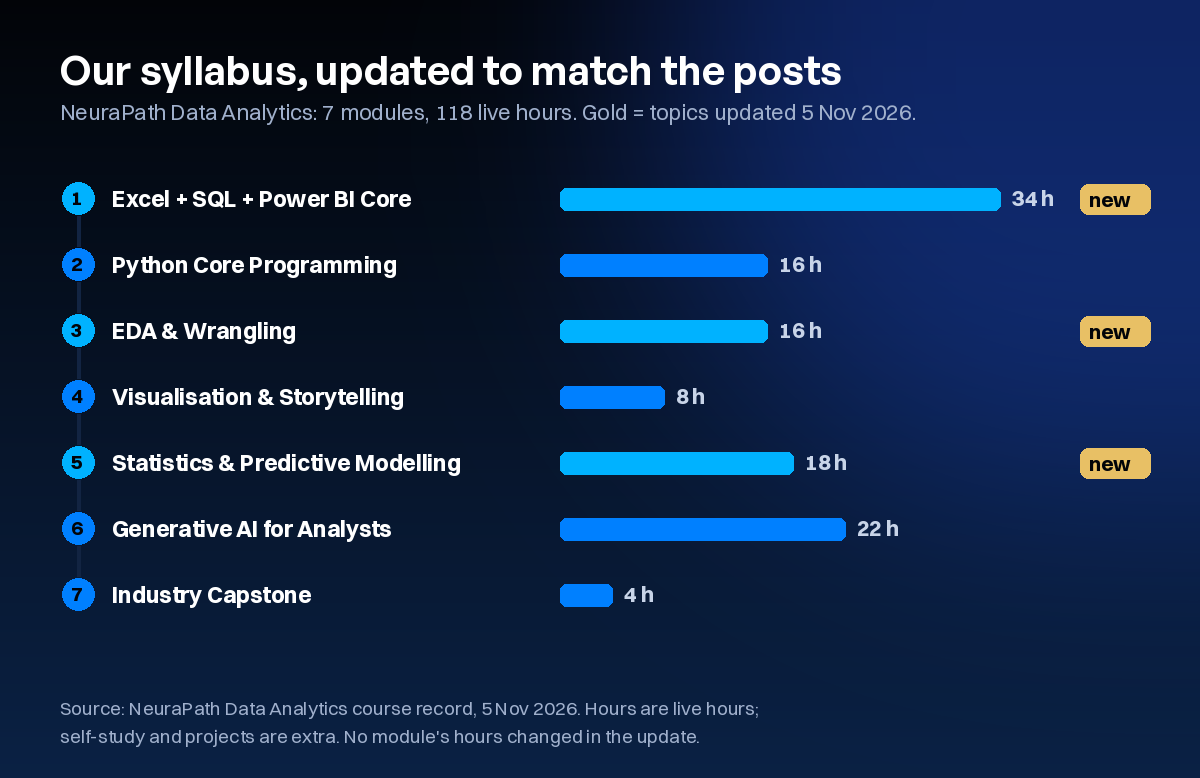
| Module | Live hours | What changed on 5 Nov 2026 |
|---|---|---|
| Excel + SQL + Power BI Core | 34 | Named Power Query, DAX with CALCULATE and time intelligence, and RLS explicitly; added Python in Excel, Copilot in Power BI, and one dashboard rebuilt in Tableau Public |
| Python Core Programming | 16 | No change |
| EDA & Wrangling | 16 | Added data validation, reconciliation to source and written metric definitions |
| Visualisation & Storytelling | 8 | No change |
| Statistics & Predictive Modelling | 18 | Reframed hypothesis testing around business questions; added reading an A/B test, funnels, cohorts and retention |
| Generative AI for Analysts | 22 | No change |
| Industry Capstone | 4 | No change |
The reason for each change is in the job posts above. Tableau because 11 of 16 posts named it. Validation because nine did. Business metrics because the analytics interviews at product companies test them.
Our Data Analytics programme, and who it is not for
I teach it myself. It runs live online, taught by working practitioners, with optional classroom labs at our Noida centre, and every session is recorded. You can take it over two months on weekdays or 3 to 4 months on weekends while you work. Every module ends in a portfolio piece, from two Power BI dashboards and a SQL case study to a RAG assistant over a business dataset and the capstone you present on demo day.
The fee is ₹90,000 (inclusive of GST) · EMI from ₹4,000/month. Eligible learners are covered by our job guarantee with minimum package assurance, or 50% of the fee back, for those meeting the attendance, deliverable and capstone criteria. Terms and conditions apply. The conditions are in our job guarantee terms: at least 70% in every assessment, at least 80% live attendance, four or more logged applications a week, fees settled, and attending the interviews we arrange, within six months of certification.
If you are still comparing courses, our data analytics course fees comparison puts published fees and live hours side by side.
Who this is not for
- People who want to build machine learning models as their main job. That is data science, and our data science syllabus covers it.
- People who cannot give it steady weekly hours for two to four months.
- People looking for a certificate rather than skills. Interviewers will ask you to write SQL live.
What to do this week
- 1Open five data analyst job posts in the city you want and write down every tool they name. Compare your list with the table above.
- 2Write one SQL query with a window function, for example a running total of sales by month. If you cannot yet, start there.
- 3Take any dashboard you have made and check one number on it against the raw data by hand.
- 4Run your CV through our free skill check to see which of these requirements you already meet.
- 5If you want to test any course's syllabus the way I did, our guide on testing a syllabus against ten job descriptions shows the method.
Still unsure whether data analytics is right for you?
Send us your current qualification or role and what you are trying to achieve. We pass it to one of our instructors, who are working data scientists, and reply with the skills you would need and whether a structured course makes sense for you at all.
Sources
- Microsoft Learn: Study guide for Exam PL-300, Power BI Data Analyst (skills measured as of 20 April 2026)
- Microsoft Learn: Copilot for Power BI overview (requirements)
- Microsoft Support: Introduction to Python in Excel
- Google Data Analytics Professional Certificate on Coursera
- World Economic Forum: Future of Jobs Report 2025 (India economy profile, p. 148)
- Stack Overflow Developer Survey 2025: AI
- LinkedIn India: data analyst job listings (the 16 posts were opened one by one on 5 Nov 2026)
Frequently asked questions
What is the syllabus of a data analyst course?
A job-ready data analyst syllabus covers Excel, SQL up to window functions and CTEs, one BI tool in depth (usually Power BI, with enough Tableau to switch), Python with Pandas, statistics for business questions, data validation, and using AI tools while checking their output. It should end in a capstone you can explain in an interview.
Which tools should a data analyst learn first in 2026?
SQL and Excel first, then Power BI. In 16 entry-level job posts we read in India on 5 Nov 2026, SQL appeared in 14, Excel in 13 and Power BI in 13. Python appeared in 12, but was often listed as good to have.
Is Python necessary for a data analyst job?
Not always for the first job, but it helps. Python appeared in 12 of the 16 posts we read, about seven times as a requirement and five as a plus. It becomes necessary once you automate reports or work with data too large for Excel.
Should a data analyst learn Power BI or Tableau?
Learn one in depth and be able to work in the other. Power BI appeared in 13 of 16 posts and Tableau in 11, usually as 'Power BI or Tableau'. Power Query, data modelling and DAX are the hard parts, and they carry over.
Do data analysts need generative AI skills?
They need to use AI tools well and check what those tools produce. Five of the 16 posts asked for AI tool use or judging AI output. None asked analysts to build agents or fine-tune models.
How long does it take to complete a data analyst syllabus?
About three to six months of steady study for a structured course. Our programme has 118 live hours, run over two months on weekdays or 3 to 4 months on weekends, plus self-study and projects.
Pankit Kumar has 10 years in Data Science & AI, building and shipping production systems in regulated pharma and clinical environments. He is a freelance trainer at Boston Institute of Analytics, AnalytixLabs and Scaler, and has taught this material to thousands of working professionals.
This article is part of our Data Analytics with Generative AI programme — 3–4 months. The full analyst stack — Excel, SQL, Power BI and Python pipelines — then a generative-AI layer you can prove is right.
Explore Data Analytics with Generative AI